Dashboard
The dashboard is a React + TypeScript app. A login screen is the only unauthenticated page; every other view requires a valid session. Timestamps are stored in UTC and rendered in the viewer's local timezone.
Global controls
- Top bar — deployment toggle, global text search, export.
- Left sidebar filters — products, date (year/month/day or 7/30/90-day presets), user, group/team, operation, category. Every KPI, chart, table, and ranking honours the active filters.
Views
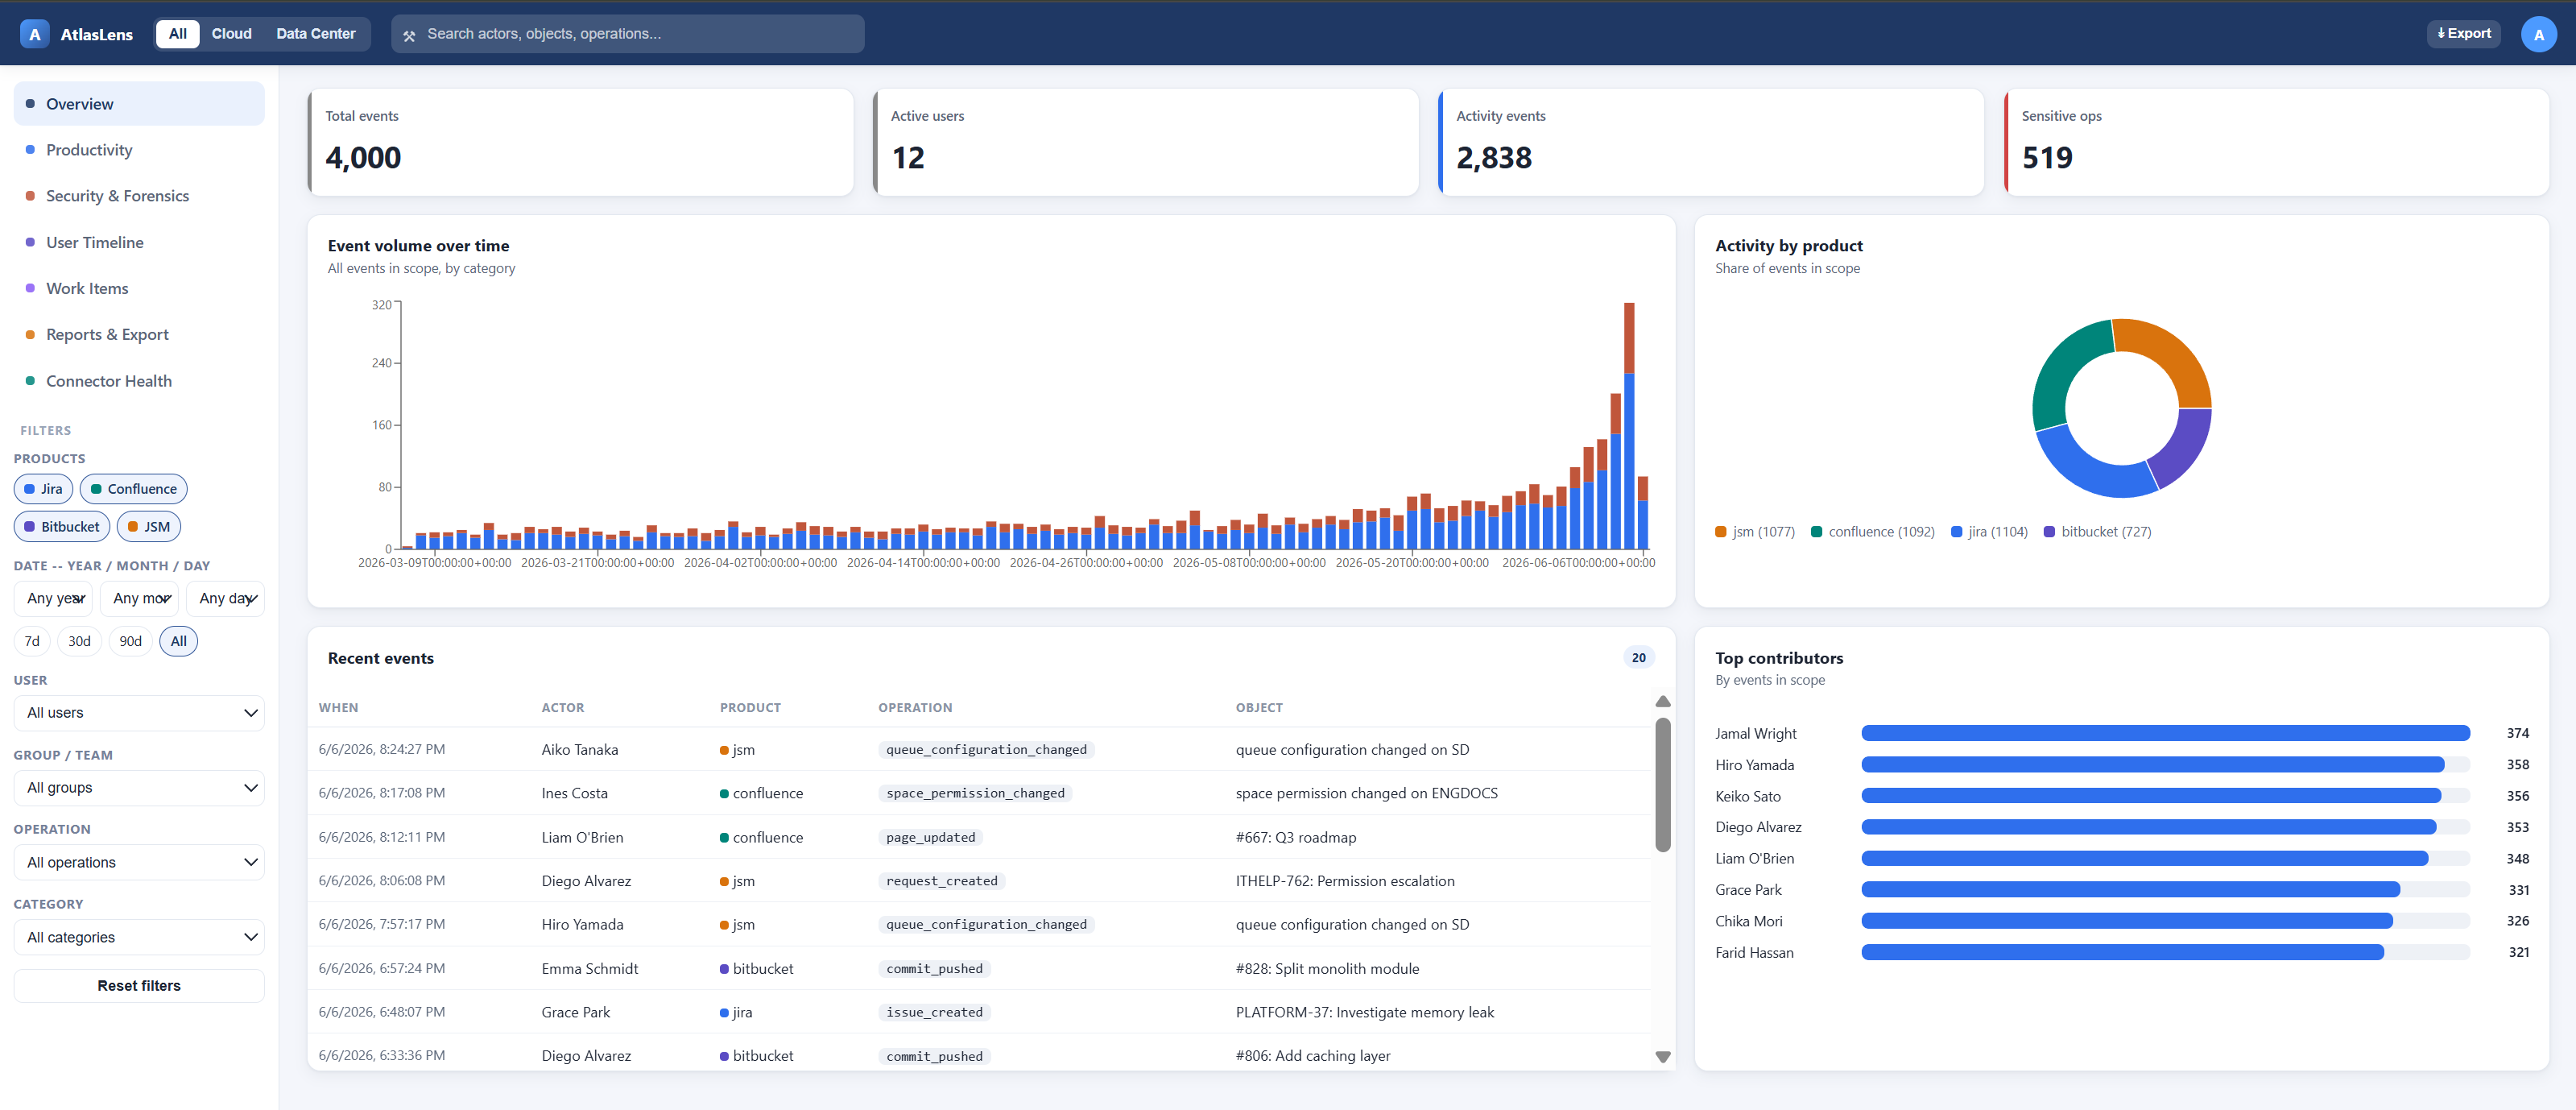
Overview
KPI cards (total events, active users, activity events, sensitive ops), an event-volume timeline, an activity-by-product split, recent events, and top contributors.
Productivity
Created-vs-updated trends, contributor and area (project/space/repo) rankings, and a recently-updated table — derived from the activity pipeline.
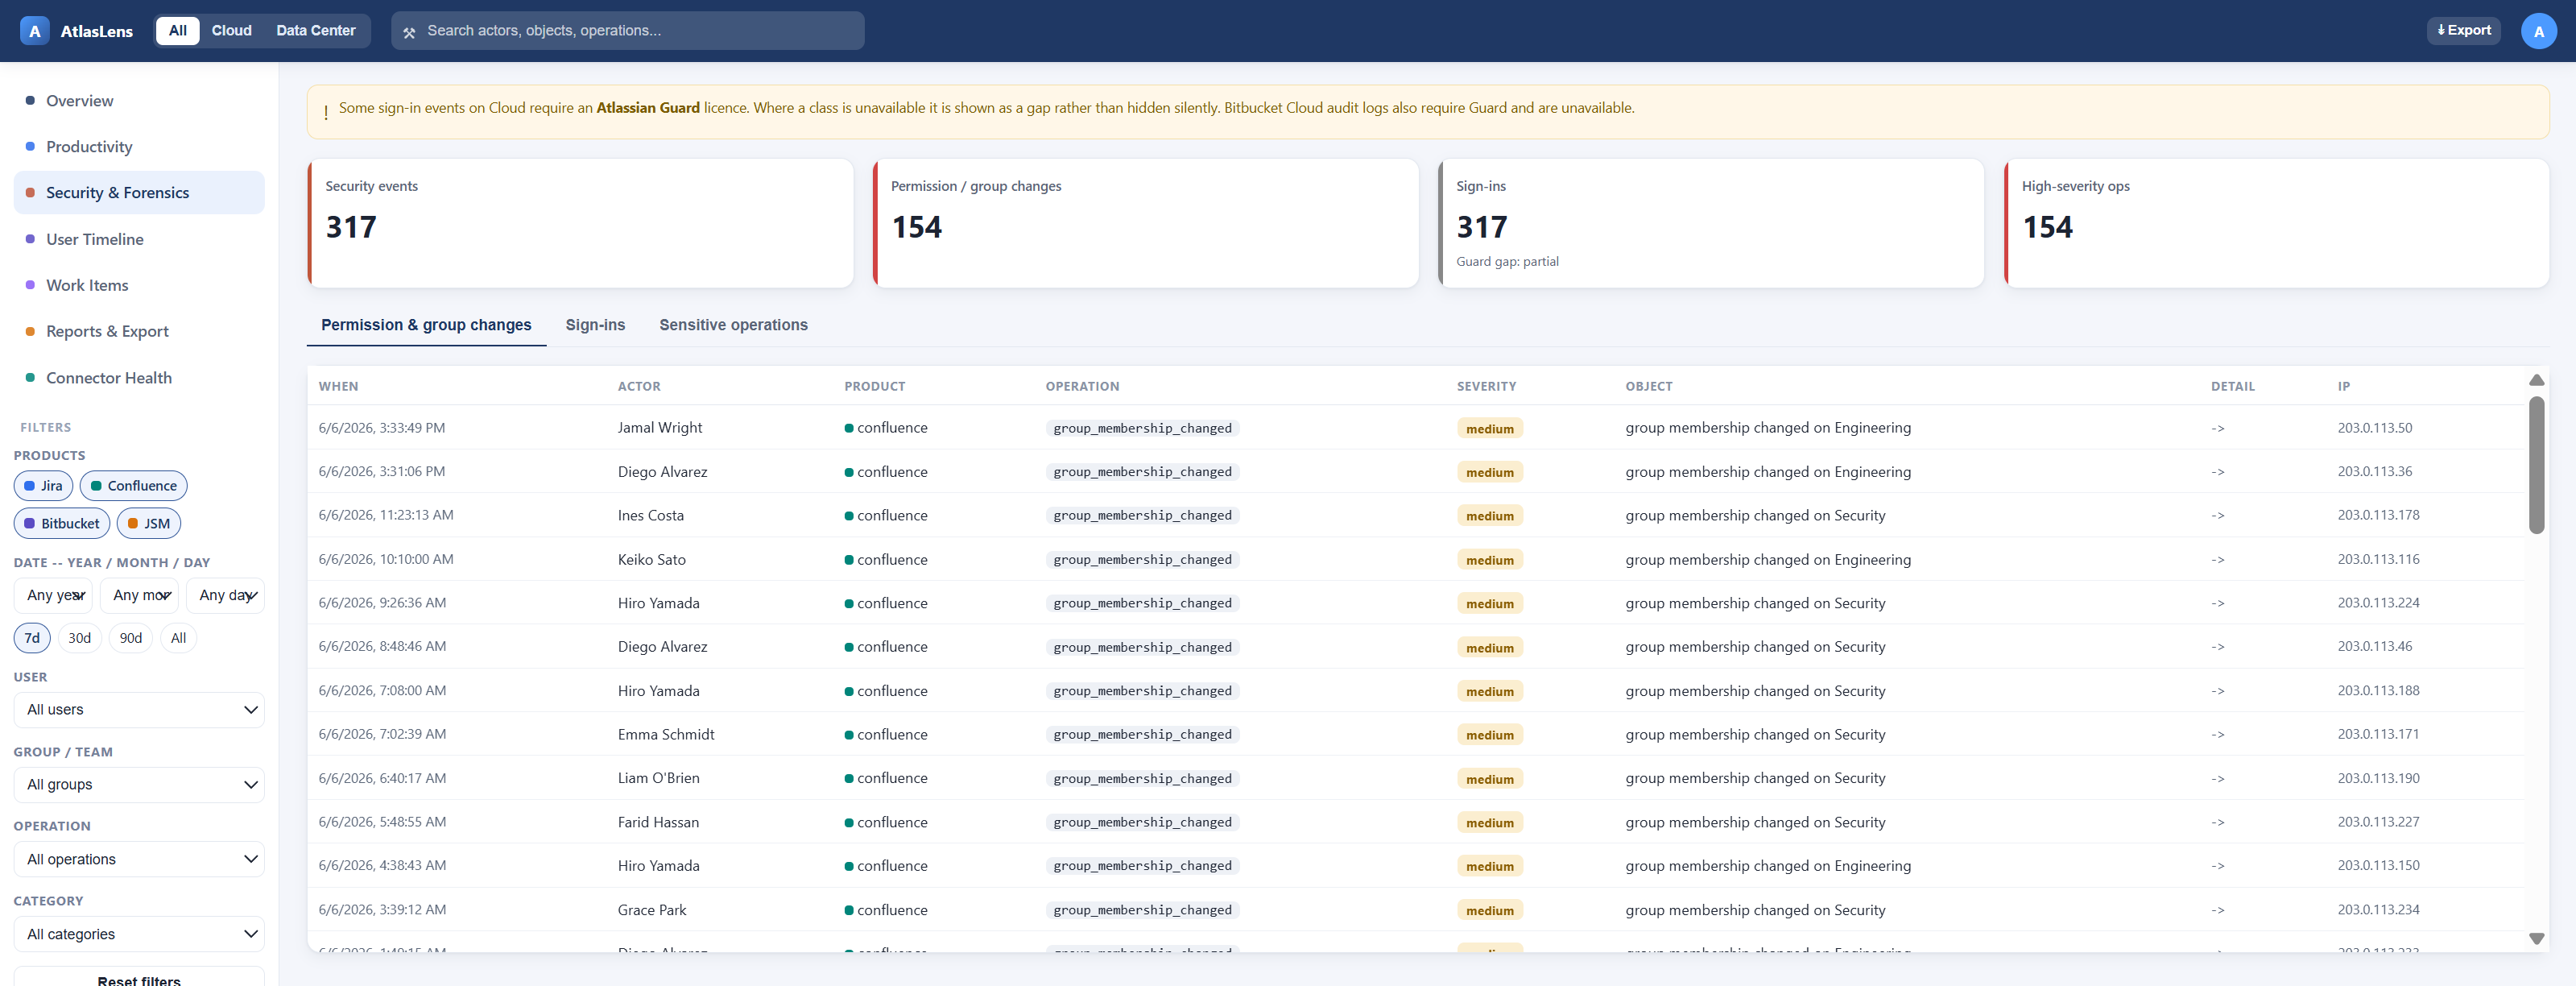
Security & Forensics
Permission and group changes, the sign-in feed (with the Guard gap surfaced honestly), and sensitive operations — derived from the audit pipeline.
User Timeline
A cross-product, per-user investigation view: everything one person did across Jira, Confluence, Bitbucket, and JSM on one timeline.
Work Items
A per-person list of the Jira/JSM tickets, Bitbucket pull requests, and Confluence pages a person created or updated — with names, deep links, and update times. Filter by product/date and sort by time.
Reports & Export
Export a filtered set to CSV or PDF. Compliance exports add an integrity stamp (row count, SHA-256, generated-at timestamp, and the filter criteria) so a report can be independently verified.
Connector Health
Live per-connector sync status, last-sync times, cursors, and errors — plus an on-demand Sync now control. See Operations.